Our Assets Companies (by Segment)
As an Asset Assembler, we are committed to relentlessly pursuing growth through the autonomous growth of each assets company (growth of existing businesses) and the assembly of new assets companies (via good and low risk M&As).
*The 2014 figures are based on JGAAP, while the figures from 2018 onwards are based on IFRS.
*Japan: The 2014 figures include NPHD expenses, and the marine business figures only include the Japanese operations. In 2023, NPHD expenses are recorded under adjustments, and the marine business figures include both the Japanese and international operations.
*NIPSEA: The 2014 figures include the international marine business, while the 2023 figures exclude it.
*DuluxGroup: The 2019 figures are pro-forma and include one-off expenses such as M&A expenses.
*Americas: The performance of Dunn-Edwards is compared using the 2018 figures because the 2017 figures, the first year post-acquisition, only covered 10 months.
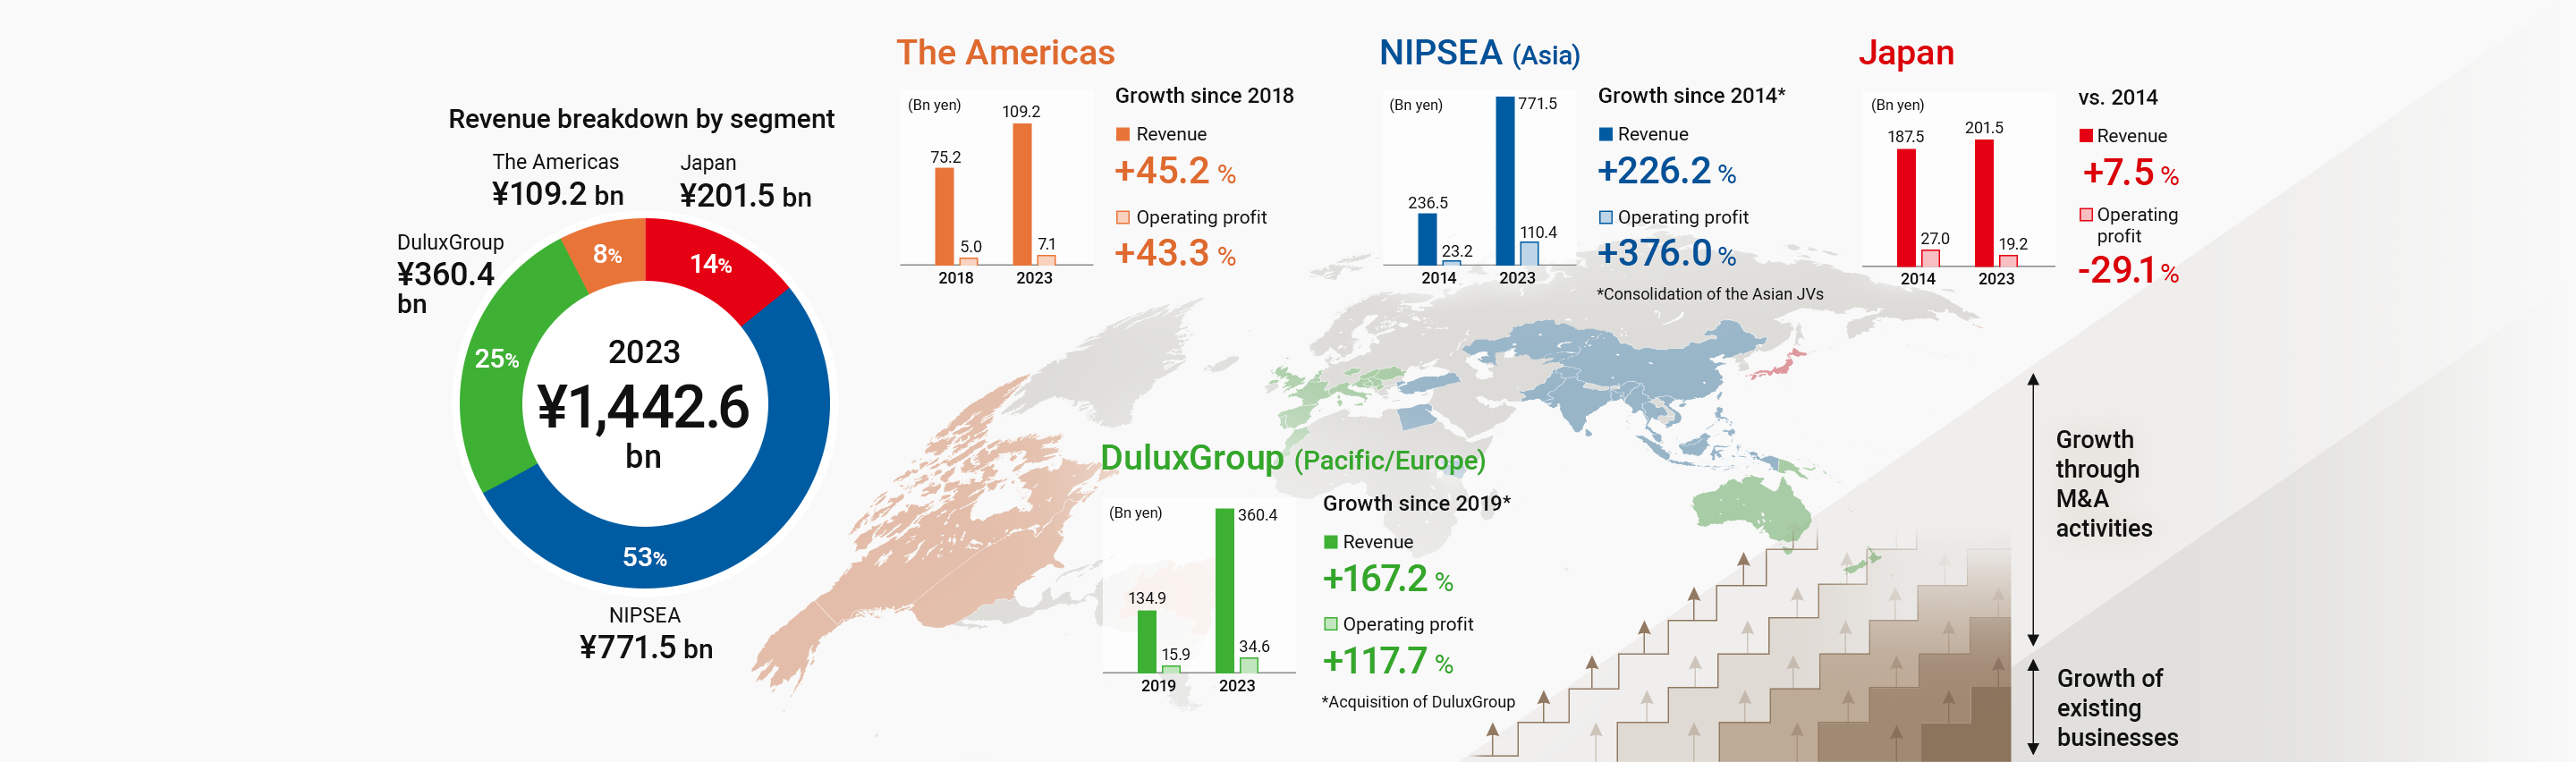
| Financial year | Revenue (Bn yen) | Operating profit (Bn yen) | Growth rate | |
|---|---|---|---|---|
| Japan Group (Consolidated) | 2014 | 187.5 | 27.0 |
vs. 2014
Revenue: +7.5%
Operating profit: -29.1%
|
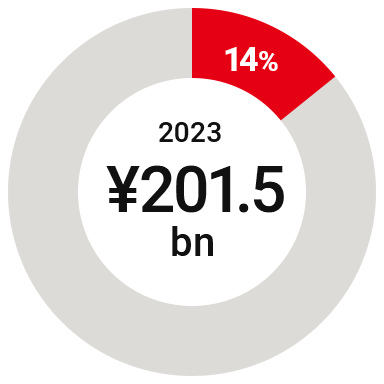
| 2023* | 201.5 | 19.2 |
* The figures are based on the new segmentation and include the international marine business. In 2023, NPHD expenses are recorded under adjustments, whereas the 2014 figures include NPHD expenses.
- FY2023 revenue breakdown
-
- Our market shares
in key market segments -

No.2
in automotive coatings
(in 2021)
No.1
in decorative paints
No.1
in industrial coatings
- Our market shares
- Key assets companies


| NIPSEA Group (Consolidated) | NIPSEA China | Betek Boya | PT Nipsea | |||||
|---|---|---|---|---|---|---|---|---|
| Financial year | 2014 | 2023*1 *2 | 2014 | 2023 | 2019 | 2023*2 | 2020*3 | 2023 |
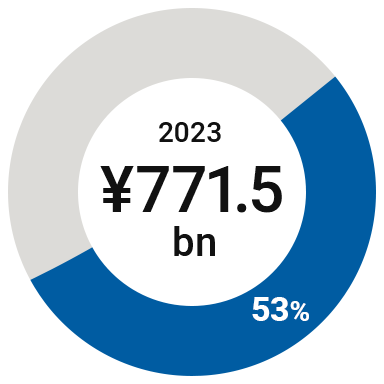
| Revenue (Bn yen) | 236.5 | 771.5 | 193.1 | 482.7 | 28.8 | 75.2 | 30.3 | 60.9 |
| Operating profit (Bn yen) | 23.2 | 110.4 | 20.2 | 60.2 | 3.3 | 8.2 | 10.2 | 20.0 |
| Growth rate |
Growth since 2014 (consolidation of the Asian JV’s)
Revenue: +226.2%
Operating profit: +376.0%
|
Growth since 2014 (consolidation of the Asian JV’s)
Revenue: +150.0%
Operating profit: +198.5%
|
Growth since the acquisition (2019)
Revenue: +160.9%
Operating profit: +147.7%
|
Growth since the acquisition (2020)
Revenue: +100.9%
Operating profit: +96.2%
|
||||
*1 The figures are based on the new segment and exclude the international marine business.
*2 The figures reflect the application of hyperinflationary accounting
*3 The figures are pro-forma.
- FY2023 revenue breakdown
-
- Our market shares
in key market segments -

No.1
in decorative paints
in five countries,
including China,
Türkiye, and SingaporeNo.2
in automotive coatings
in Asia (in 2021)
- Our market shares
- Key assets companies
- Key business areas
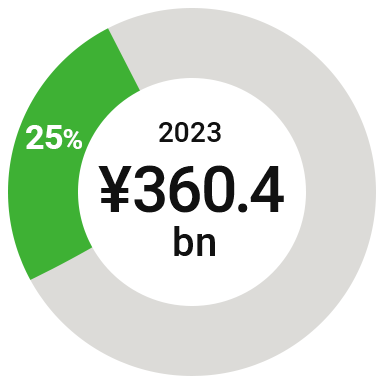
DuluxGroup (Pacific/Europe)
DuluxGroup operates in 22 countries in the Pacific (Australia, New Zealand, and Papua New Guinea) and Europe with the leading position in the decorative paints market in four countries, including Australia, and the third position in six countries. DuluxGroup is driving growth in our Group, delivering steady growth year after year.
| DuluxGroup (Consolidated) | DGL (Pacific) | DGL (Europe) | ||||
|---|---|---|---|---|---|---|
| Financial year | 2019 | 2023 | 2019 | 2023*2 | 2021*3 | 2023*2 |
| Revenue (Bn yen) | 134.9 | 360.4 | 134.9 | 222.5 | 109.1 | 137.9 |
| Operating profit (Bn yen) | 15.9*1 | 34.6 | 15.9*1 | 28.5 | 9.7 | 6.1 |
| Growth rate |
Growth since the acquisition (2019)
Revenue: +167.2%
Operating profit: +117.7%
|
Growth since the acquisition (2019)
Revenue: +65.0%
Operating profit: +79.4%
|
Growth since the acquisition (2021)
Revenue: +26.4%
Operating profit: -37.2%
|
|||
*1 The figures are pro-forma and include one-off expenses such as M&A expenses.
*2 Craig&Rose and Maison Deco are included in DGL (Europe)
*3 The figures are pro-forma.
- FY2023 revenue breakdown
-
- Our market shares
in key market segments -
No.1
in decorative paints
in four countries,
including
Australia,
Italy, and Slovenia
- Our market shares
- Key assets companies
- Key business areas
| Financial year | Revenue (Bn yen) | Operating profit (Bn yen) | Growth rate | |
|---|---|---|---|---|
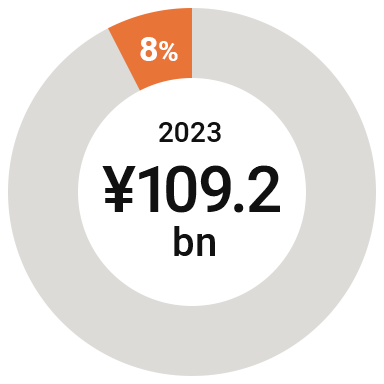
| Americas (Consolidated) | 2018* | 75.2 | 5.0 |
Growth since 2018
Revenue: +45.2%
Operating profit: +43.3%
|
| 2023 | 109.2 | 7.1 | ||
| Dunn-Edwards | 2018* | 44.6 | ‐ |
Growth since 2018
Revenue: +48.9%
|
| 2023 | 66.4 | ‐ |
* Dunn-Edwards’ performance is compared using the 2018 figures because the 2017 figures, the first year post-acquisition, only covered 10 months following its acquisition in March 2017
- FY2023 revenue breakdown
-
- Our market shares
in key market segments -
Market share
in decorative paints:
2.5%No.4
in automotive coatings
in North America (in 2021)
- Our market shares
- Key assets companies
- Key business areas